import pandas as pd
import nltk
nltk.download('punkt')

from nltk.tokenize import sent_tokenize
[nltk_data] Downloading package punkt to /Users/nealcaren/nltk_data...
[nltk_data] Package punkt is already up-to-date!import pandas as pd
import nltk
nltk.download('punkt')
from nltk.tokenize import sent_tokenize[nltk_data] Downloading package punkt to /Users/nealcaren/nltk_data...
[nltk_data] Package punkt is already up-to-date!Load a CSV file I created from a Scopus search for specific sociology journals over the last decade.
df = pd.read_json('https://raw.githubusercontent.com/nealcaren/notes/main/posts/abstracts/sociology-abstracts.json')
df['Year'].value_counts()
Year
2018 1076
2017 1068
2019 1033
2015 1031
2016 989
2021 983
2022 972
2020 932
2014 870
2023 843
Name: count, dtype: int64df['Source title'].value_counts()Source title
Demography 890
Journal of Marriage and Family 757
Social Science Research 672
Social Forces 594
Sociological Forum 503
Sociological Perspectives 455
American Sociological Review 417
Social Networks 407
Sociological Methods and Research 381
Social Problems 366
Gender and Society 326
American Journal of Sociology 324
Journal of Health and Social Behavior 314
Sociological Inquiry 310
Sociology of Race and Ethnicity 289
Theory and Society 287
Sociological Science 271
City and Community 260
Social Currents 255
Symbolic Interaction 244
Qualitative Sociology 229
Mobilization 207
Social Psychology Quarterly 201
Poetics 183
Du Bois Review 182
Sociology of Education 171
Sociological Theory 160
Work and Occupations 142
Name: count, dtype: int64def first_sentence(abstract):
sentences = sent_tokenize(abstract)
return sentences[0]
# Apply the function to the 'Abstract' column to create the new feature
df['abstract_first_sentence'] = df['Abstract'].apply(first_sentence)df['abstract_first_sentence_punctuation'] = df['abstract_first_sentence'].str[-1]
df['abstract_first_sentence_punctuation'].value_counts()abstract_first_sentence_punctuation
. 9290
? 480
" 24
) 2
! 1
Name: count, dtype: int64# Okay, who used the exclamation mark?!!!
screen = df['abstract_first_sentence_punctuation']=="!"
df[screen]| DOI | Source title | Year | Authors | Title | Abstract | abstract_first_sentence | abstract_first_sentence_punctuation | |
|---|---|---|---|---|---|---|---|---|
| 4178 | 10.1086/700831 | American Journal of Sociology | 2018 | Padgett J.F. | Faulkner’s assembly of memories into history: ... | In Absalom, Absalom! William Faulkner develops... | In Absalom, Absalom! | ! |
# It was a parsing error. So sad!df['abstract_starts_with_a_question'] = df['abstract_first_sentence_punctuation'] == '?'
df['abstract_starts_with_a_question'].mean()0.04899459018066755import seaborn as sns
import matplotlib.pyplot as plt
import matplotlib.ticker as mtick
# Set the Seaborn theme
sns.set_theme(style="white")
# Create the plot with pandas, now styled by Seaborn
ax = pd.crosstab(df['Source title'],
df['abstract_starts_with_a_question'], normalize='index').sort_values(by=True)[True].plot(kind='barh', figsize=(6, 6))
# Add a title and possibly adjust other aspects like labels
plt.title('What percent of journal abstracts start with a question?')
plt.xlabel('')
plt.ylabel('')
# Format the x-axis as percentages
ax.xaxis.set_major_formatter(mtick.PercentFormatter(1.0, decimals=0))
# Remove the top and right borders
sns.despine()
# Show the plot
plt.show()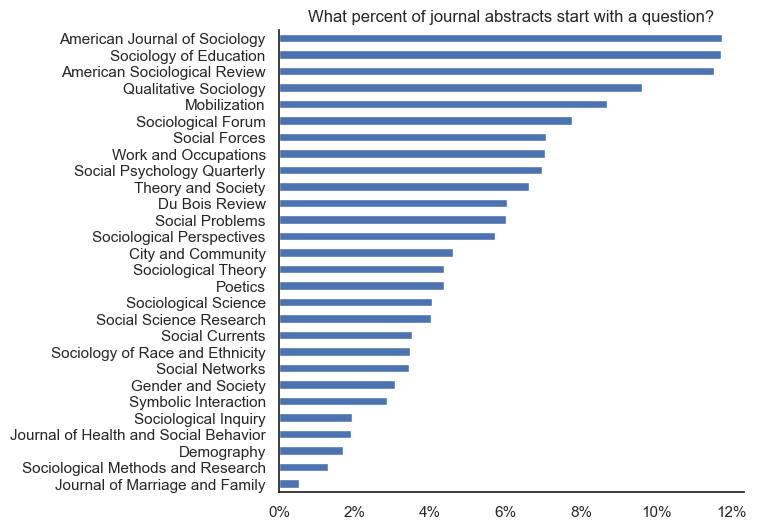
df['abstract_first_word'] =  df['abstract_first_sentence'].str.split().str[0]
df[df['abstract_starts_with_a_question']]['abstract_first_word'].value_counts()[:10]
abstract_first_word
How 163
What 65
Why 59
Does 31
Do 28
When 16
Is 15
Are 12
Can 10
This 7
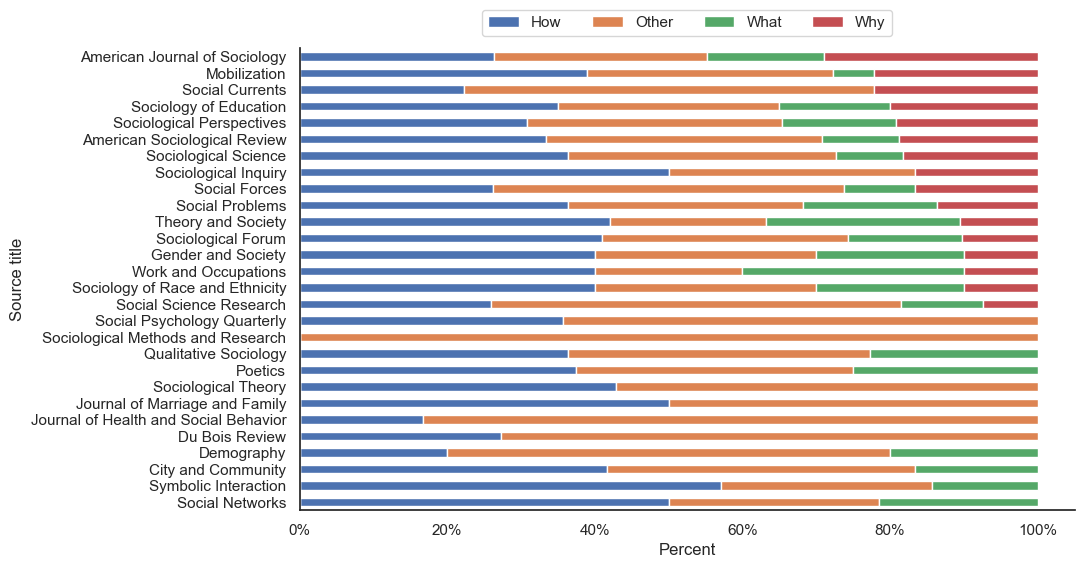
Name: count, dtype: int64dfa = df[df['abstract_starts_with_a_question']==True].copy()# Step 1: Prepare the Data
# Categorize 'abstract_first_word' into "How", "What", "Why", and "Other"
dfa['category'] = dfa['abstract_first_word'].apply(lambda x: x if x in ['How', 'What', 'Why'] else 'Other')
# Create a crosstab/pivot table for the count or proportion of each category by 'Source title'
data_for_plot = pd.crosstab(dfa['Source title'], dfa['category'], normalize='index').sort_values(by='Why')
# Step 2: Plot the Stacked Bar Plot
# Set the Seaborn theme
sns.set_theme(style="white")
# Plot
ax = data_for_plot.plot(kind='barh', stacked=True, figsize=(10, 6))
# Add a title and adjust labels
plt.xlabel('Percent')
plt.ylabel('Source title')
# Format the x-axis as percentages
ax.xaxis.set_major_formatter(mtick.PercentFormatter(xmax=1.0, decimals=0))
# Remove the top and right borders
sns.despine()
ax.legend(loc='upper center', bbox_to_anchor=(0.5, 1.1), ncol=4)
# Show the plot
plt.show()